Calculating Degree Days in Home Assistant
Calculating Degree Days (or Graaddag in Dutch) allows you to benchmark gas consumption in relation to temperature. The formula is quite simple, it uses as reference temperature 18°C minus the average temperature of the day, minimized on 0°C. The concept is based on the idea that the amount of energy needed to maintain a comfortable indoor temperature increases as the difference between the indoor temperature and the outdoor temperature increases. By tracking the degree days, it is possible to estimate how much energy is needed to heat or cool a building and compare it to the actual energy usage.
TIP
An addition has been written adjusting the gas usage with the occupancy rate.
This configuration is using the Home Assistant platform to define three sensors: outside_temperature_avg, degree_day_daily and gas_m3_per_degree_day.
- The
outside_temperature_avgsensor, based on the statistics module calculates the average temperature over the past 24h. It’s important to notemax_ageandsampling_sizeneed to both specified, see the HA Community: Statistics max_age and sampling_size for more info. - The
degree_day_dailysensor calculates the difference between a regularized temperature (18.0°C in this case) and the average temperature reported by thesensor.outside_temperature_avgsensor over the past 24 hours. - The
gas_m3_per_degree_daysensor calculates the gas usage (as reported by thesensor.gas_delivery_dailysensor) per degree day, which is defined as the difference between the regularized temperature and the average/mean temperature.
Both sensors are triggered to update at the same time, 23:59:01 and 23:59:59 respectively, which corresponds to the end of the day.
1
2
3
4
5
6
7
8
9
10
11
12
13
14
15
16
17
18
19
20
21
22
23
24
25
26
27
28
29
30
31
32
33
34
35
36
37
38
39
40
41

sensor:
  - platform: statistics
    name: "outside_temperature_avg"
    entity_id: sensor.garden_garden_temperature_noordkant_temperature
    state_characteristic: mean
    max_age:
      hours: 24
    sampling_size: 1440

template:
  - trigger:
      platform: time
      at: "23:59:01"
    sensor:
    - name: degree_day_daily
      state: >
        {% set regularized_temp = 18.0 | float %}
        {% set average_outside_temp = states('sensor.outside_temperature_avg') | float %}
        {% set dd = regularized_temp - average_outside_temp %}
        {% if dd > 0 %}
          {{ dd }}
        {% else %}
          0
        {% endif %}
      unit_of_measurement: 'DD'
  - trigger:
      platform: time
      at: "23:59:59"
    sensor:
    - name: gas_m3_per_degree_day
      state: >
        {% set gas_usage = states('sensor.gas_delivery_daily') | float %}
        {% set dd = states('sensor.degree_day_daily') | float %}
        {% if dd > 0 %}
          {{ gas_usage / dd }}
        {% else %}
          0
        {% endif %}
      unit_of_measurement: 'm³/DD'
You can find the implementation in my NixOS config nathan-gs/nix-conf as well.
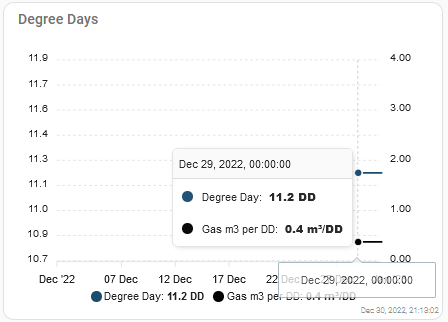
Dashboard
Let’s add a basic dashboard using ApexCharts Card:
1
2
3
4
5
6
7
8
9
10
11
12
13
14
15
16
17
18
19
20
21
22
23
24
25
26
27
28
29
30
31
32
33
34
35
36
37
38
39
40
41
42
43
44
45
46
type: custom:apexcharts-card
graph_span: 31d
span:
  start: month
show:
  last_updated: true
yaxis:
  - id: dd
    apex_config:
      forceNiceScale: true
      decimalsInFloat: 1
      tickAmount: 7
  - id: gas_per_dd
    opposite: true
    min: 0
    max: 4
    apex_config:
      forceNiceScale: false
      decimalsInFloat: 2
      tickAmount: 4
color_list:
  - '#1a4c6e'
header:
  show: true
  title: Degree Days
series:
  - entity: sensor.degree_day_daily
    name: Degree Day
    type: line
    group_by:
      func: last
      duration: 1d
    stroke_width: 2
    show:
      header_color_threshold: true
    yaxis_id: dd
  - entity: sensor.gas_m3_per_degree_day
    name: Gas m3 per DD
    type: line
    color: black
    group_by:
      func: last
      duration: 1d
    stroke_width: 2
    yaxis_id: gas_per_dd
TIP
Definitely take a look at the newer blog post adjusting the degree day gas usage with the occupancy rate.