Flanders/Belgium's Capacity Tariffs in Home Assistant
Flanders will reform the nettariffs for electricity transport, shifting a larger cost to peak usage. They do this by measuring your average consumption per 15m and the maximum quarter of the month counts as your tariff. Currently information and dashboards from Fluvius are cumbersome to use (CSV export and then leveraging Excel to spot the highest quarter).
I’m tracking my Electricity / Gas / Water in Home Assistant already, so let’s take a look what we need to do. This was inspired by a Forum thread at Capaciteitstarief maandpiek zichtbaar maken in home assistant (userbase.be).
In December 2023 I created Capacity Tariffs and Home Assistant improvements post.
TIP
Likely with the latest firmware’s your DSMR/P1 meter includes the
electricity_delivery_power_15mand theelectricity_delivery_power_monthly_15m_maxsensors. Take a look at my Capacity Tariffs and Home Assistant improvements post from 2023
Track 15m values
We will be using the utility_meter integration to generate these values:
1
2
3
4
5
utility_meter:
  electricity_delivery_15m:
    source: sensor.electricity_delivery
    cron: "*/15 * * * *"
Side-note for Peak & Offpeak
If you receive data in peak & offpeak measurements; best to sum them before:
1
2
3
4
5
template:
- sensor:
  - name: electricity_delivery
  unit_of_measurement: "kWh"
  state: "{{ ( states('sensor.electricity_peak_delivery') | float ) + ( states('sensor.electricity_offpeak_delivery') | float ) }}"
Calculate the 15m power
We now have the numbers in kWh (energy) but we need to convert to kW (power); we do this by multiplying by 4 (1h per quarter).
1
2
3
4
5
template:
- sensor:
  - name: electricity_delivery_power_15m
  unit_of_measurement: "kW"
  state: "{{ (states('sensor.electricity_delivery_15m') | float(0)) * 4 | float }}"
Calculate the daily and monthly max
To calculate the 15m max for the day & month, we are using the following template, with a time_pattern trigger.
1
2
3
4
5
6
7
8
9
10
11
12
13
14
15
16
17
18
19
20
21
22
23
24
25
26
27
28
29
30
31
32
33
34
35
36
37
template:
  trigger:
    platform: time_pattern
    minutes: "/15"
  sensor:
  - name: electricity_delivery_power_daily_15m_max
    state: >
      {% if is_number(states('sensor.electricity_delivery_power_daily_15m_max')) %}
        {% if ((now().hour == 0) and (now().minute < 15)) %}
          {{ states('sensor.electricity_delivery_power_15m') | float }}
        {% else %}
          {% if ((states('sensor.electricity_delivery_power_daily_15m_max') | float) < (states('sensor.electricity_delivery_power_15m')) | float) %}
            {{ states('sensor.electricity_delivery_power_15m') or 0 | float }}
          {% else %}
            {{ states('sensor.electricity_delivery_power_daily_15m_max') | float }}
          {% endif %}
        {% endif %}
      {% else %}
        0
      {% endif %}
    unit_of_measurement: 'kW'
  - name: electricity_delivery_power_monthly_15m_max
    state: >
      {% if is_number(states('sensor.electricity_delivery_power_monthly_15m_max')) %}
        {% if ((now().day == 1) and (now().hour == 0) and (now().minute < 15)) %}
          {{ states('sensor.electricity_delivery_power_15m') | float }}
        {% else %}
          {% if ((states('sensor.electricity_delivery_power_monthly_15m_max') | float) < (states('sensor.electricity_delivery_power_15m')) | float) %}
            {{ states('sensor.electricity_delivery_power_15m') or 0 | float }}
          {% else %}
            {{ states('sensor.electricity_delivery_power_monthly_15m_max') | float }}
          {% endif %}
        {% endif %}
      {% else %}
        0
      {% endif %}
    unit_of_measurement: 'kW'
Visualizing
Making use of Apexcharts Card, visualizing some elements
1
2
3
4
5
6
7
8
9
10
11
12
13
14
15
16
17
18
19
20
21
22
23
24
25
26
27
28
29
30
31
32
33
34
35
36
37
38
39
40
41
42
43
44
45
46
47
48
49
50
51
52
53
54
55
56
57
58
59
60
61
62
63
64
65
66
67
68
69
70
71
72
73
74
75
76
77
78
79
80
81
82
83
84
85
86
87
88
89
90
type: vertical-stack
cards:
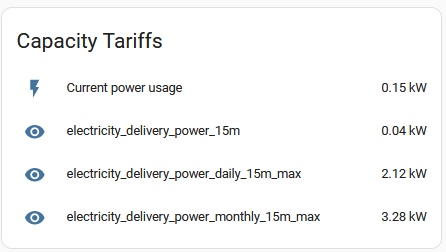
- type: entities
entities:
- entity: sensor.dsmr_reading_electricity_currently_delivered
- entity: sensor.electricity_delivery_power_15m
- entity: sensor.electricity_delivery_power_daily_15m_max
- entity: sensor.electricity_delivery_power_monthly_15m_max
state_color: false
title: Capacity Tariffs
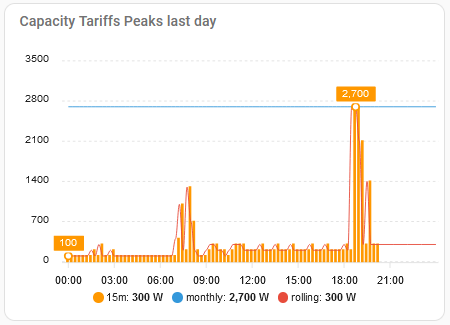
- type: custom:apexcharts-card
graph_span: 24h
span:
start: day
header:
show: true
title: Capacity Tariffs Peaks last day
apex_config:
yaxis:
- id: first
forceNiceScale: true
decimalsInFloat: 0
opposite: false
name: Energie
all_series_config:
stroke_width: 1
series:
- entity: sensor.electricity_delivery_power_15m
unit: W
type: column
name: 15m
stroke_width: 2
transform: return x * 1000;
group_by:
duration: 15m
func: last
show:
datalabels: false
extremas: true
- entity: sensor.electricity_delivery_power_monthly_15m_max
unit: W
type: line
name: monthly
transform: return x * 1000;
group_by:
duration: 15m
func: last
show:
datalabels: false
extremas: false
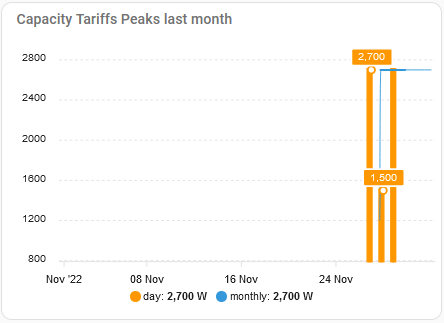
- type: custom:apexcharts-card
graph_span: 31d
span:
start: month
header:
show: true
title: Capacity Tariffs Peaks last month
apex_config:
yaxis:
- id: first
forceNiceScale: true
decimalsInFloat: 0
opposite: false
name: Energie
all_series_config:
stroke_width: 1
series:
- entity: sensor.electricity_delivery_power_daily_15m_max
unit: W
type: column
name: day
stroke_width: 4
transform: return x * 1000;
group_by:
duration: 1d
func: max
show:
datalabels: false
extremas: true
- entity: sensor.electricity_delivery_power_monthly_15m_max
unit: W
type: line
name: monthly
transform: return x * 1000;
group_by:
duration: 15m
func: last
show:
datalabels: false
extremas: false
Triggering a warning on too much power use
Let’s create a binary_sensor to trigger if we are using too much power. The following code will trigger if we consume more than 2800W for more than 2m.
1
2
3
4
5
6
template:
- binary_sensor:
  - name: electricity_delivery_power_max_threshold_reached
    delay_on: 00:02:00
    delay_off: 00:01:00
    state: "{{ states('sensor.electricity_delivery') | float > 2800 }}"
A notification to the Home Assistant mobile apps
As automation:
1
2
3
4
5
6
7
8
9
10
11
12
13
14
automations:
- id: electricity_delivery_power_max_threshold_reached_send_notification
  alias: electricity_delivery_power_max_threshold_reached_send_notification
  trigger:
  - platform: state
    entity_id: binary_sensor.electricity_delivery_power_max_threshold_reached
    to: on
  condition:
  action:
  - service: notify.notify
    data:
      title: "Electricity Peak; ({{  (states('sensor.dsmr_reading_electricity_currently_delivered') | float * 1000) }}W (max 2800w)"
      message: "Electricity Peak; ({{  (states('sensor.dsmr_reading_electricity_currently_delivered') | float * 1000) }}W (max 2800w)"
  mode: single
Final notes
Initially I started using the statistics model, however using utility_meter is likely more accurate.
Take a look at my Capacity Tariffs and Home Assistant improvements post from 2023 to spot some additional solutions.