Predicting Occupancy on the Belgian railroads, based on spitsgids/iRail data, using Azure ML.
This post first appeared on medium.com.
Pieter Colpaert, the #opendata specialist in Belgium did a call to the community to try and predict which train will have high occupancy.
Any machine learning experts that want to help me to predict occupancy on Belgian trains? Ground truth available: https://t.co/5MWsmBkHkw
— Pieter Colpaert (@pietercolpaert) October 29, 2016
I am not a Data Scientist, but decided to give it a try on Azure Machine Learning, my employer’s Machine Learning offer in the Cloud. I used the free version to create this. Using Azure ML you can use the build in algorithms, or use Python or R scripts. We also have Jupyter notebooks available to quickly explore the data.
Reading & exploring the data
Pieter made available a json dataset, which contain following fields:
- querytype
- querytime
- user_agent
- post.connection
- post.from
- post.date
- post.vehicle
- post.occupancy
- post.to
Reading in the data
To read in the data I am going to use an simple R script, because it’s a json, that we also need to flatten. Just add Execute R Script as the first block. The json is not a valid json, it’s ndjson so we need to use the stream_in method of jsonlite.
1
2
3
4
5
6
7
8
library(jsonlite)
library(plyr)

con <- url("http://gtfs.irail.be/nmbs/feedback/occupancy-until-20161029.newlinedelimitedjsonobjects")
mydata <- flatten(jsonlite::stream_in(con), recursive=TRUE)
data.set = mydata

maml.mapOutputPort("data.set")
The data now looks like:
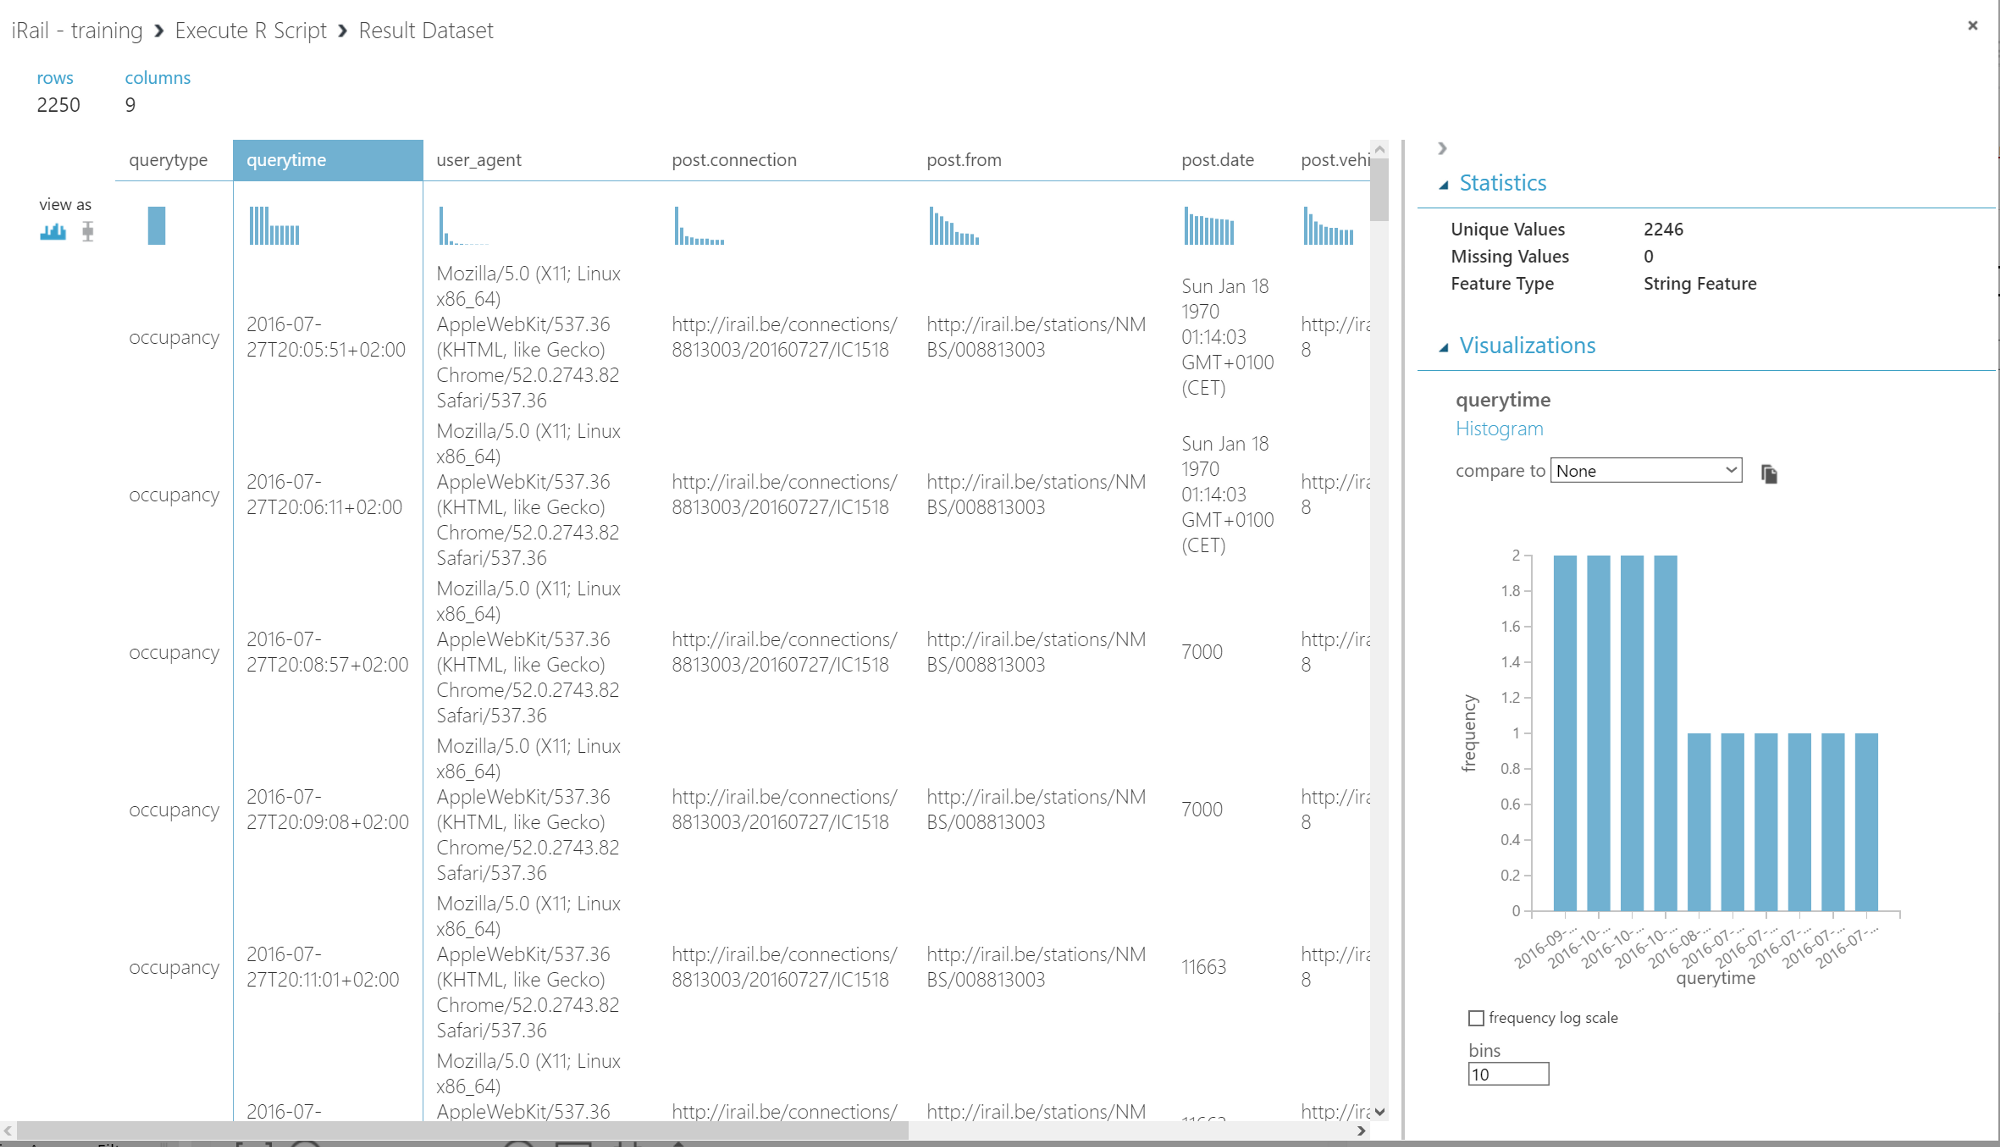
Converting querytime to DateTime
We are going to convert the querytime to a DateTime, using Edit Metadata, launch the column selector and select the querytime field, as field type select DateTime. No need to insert the format.
Extracting the hour, the quarter, the day of the week and making a readable label.
Using Apply SQL Transformation, which allows you to use the full SQLite syntax to do transformations, aggregations on your data. We use following script, unfortunately we need to do a few tricks because there is no LPAD in SQLite.
1
2
3
4
5
6
select
time(strftime('%H', ts) || ':' || substr((cast(strftime('%M', ts) / 15 as int) * 15) || '0', 1, 2)) as [time],
strftime('%w', ts) as [day_of_week],
substr([post.occupancy], 27) as [label],
 *
from t1;
We are converting the DateTime to a Hour:Quarter combination, because we want to have more overlap. We also extract the day of week, because weekend vs non-weekend might have a big impact.
As last step we are going to extract only the fields we need
Using Select Columns in Dataset we are going to extract the features + label (all fields) we think are relevant. I used the following:
- post.from
- post.to
- time
- day_of_week
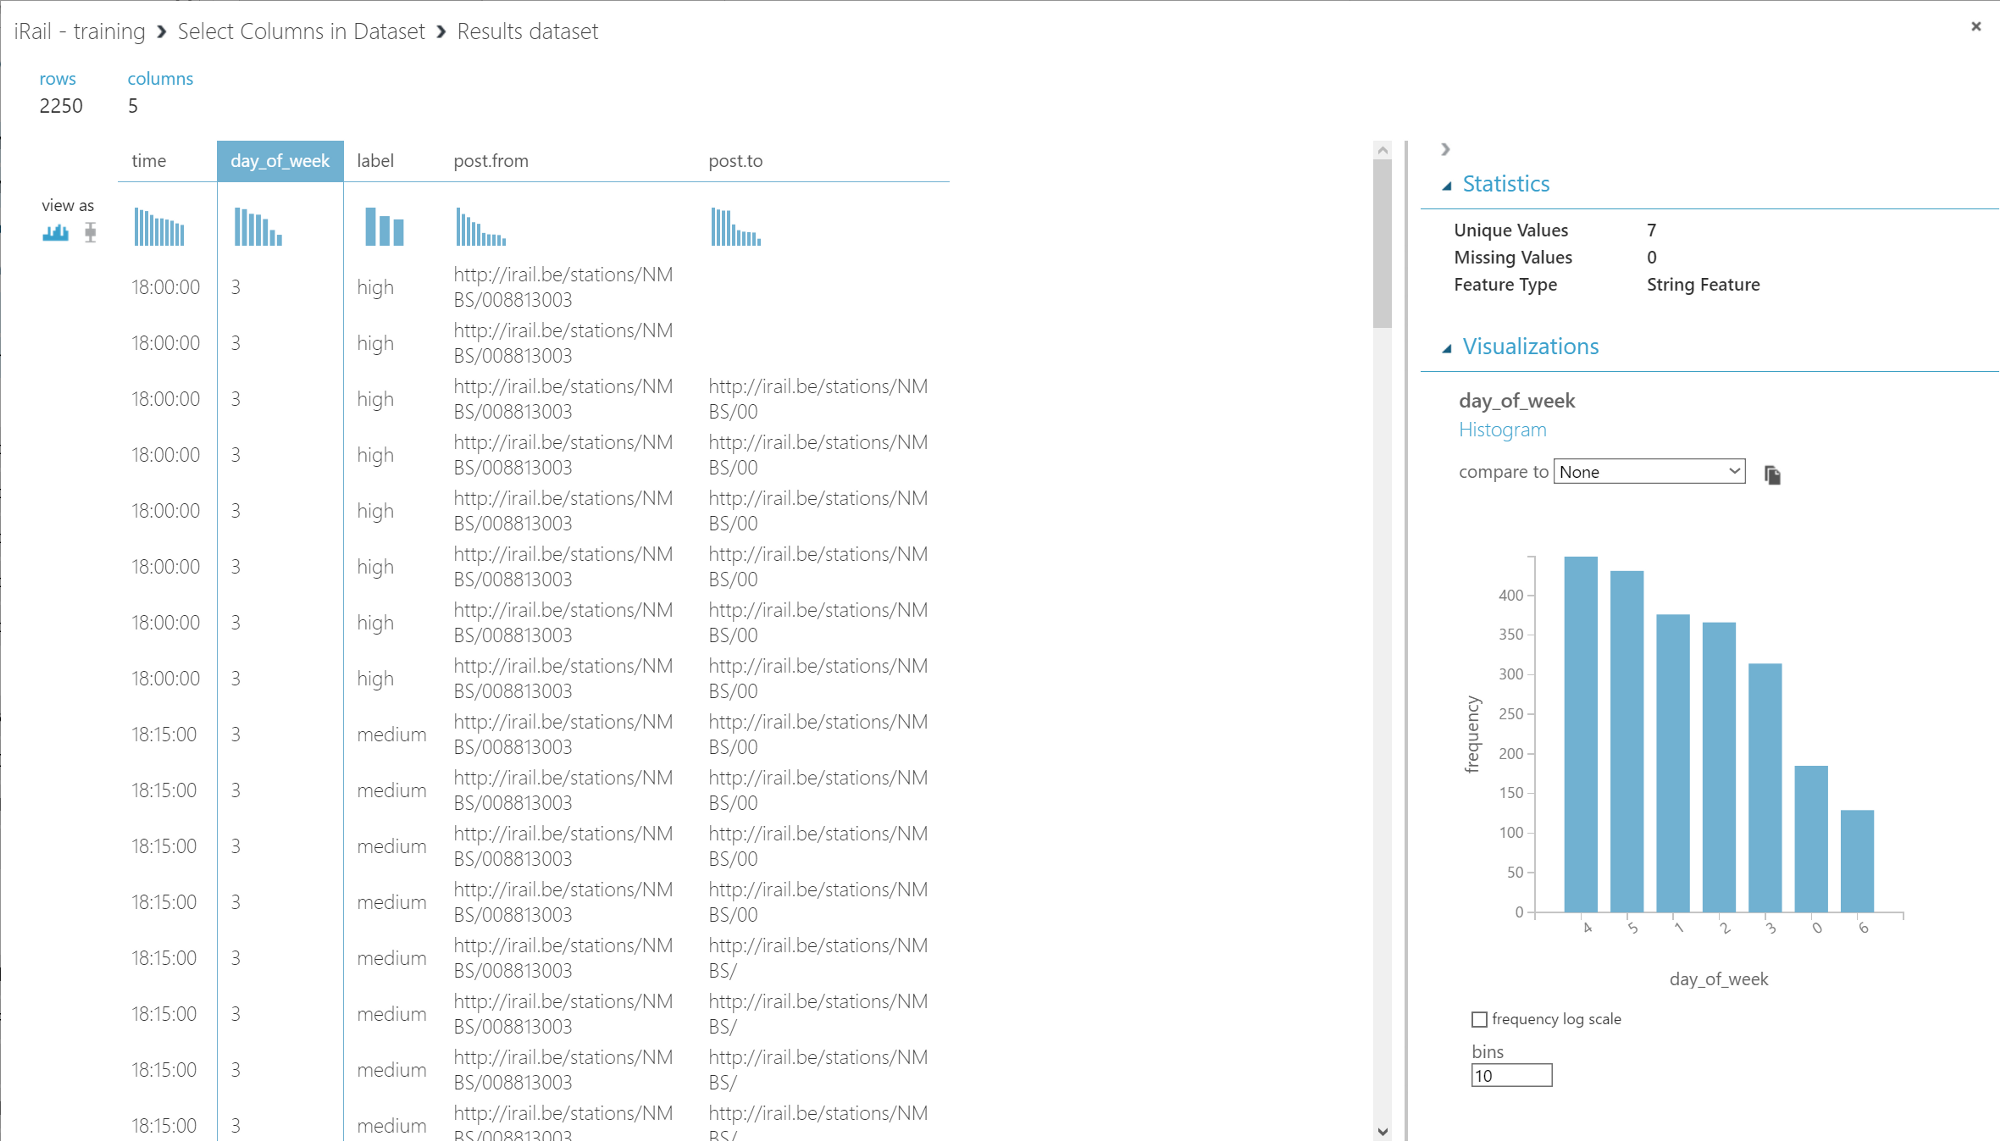
- label
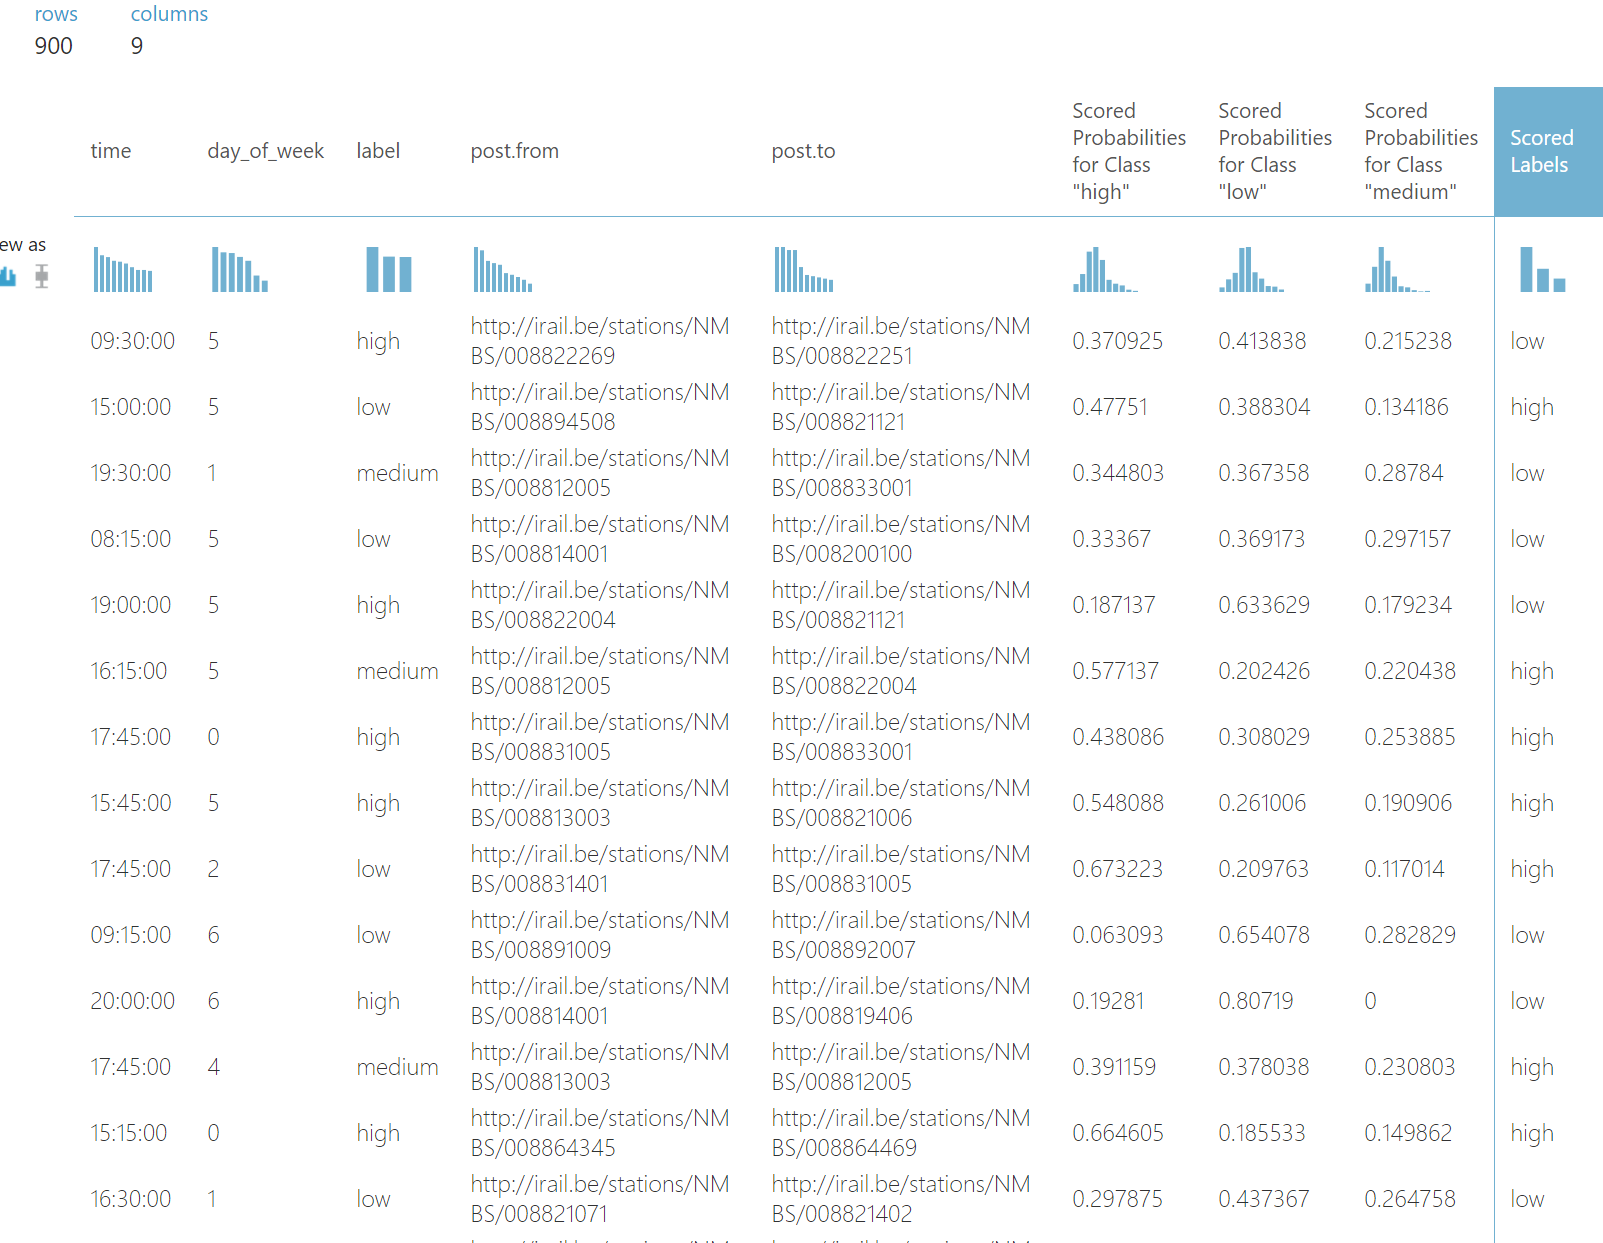
Our data now looks like this
One of the advantages of using Azure ML is quickly looking at how the data looks like. Seeing the distributions inside an individual column, etc.
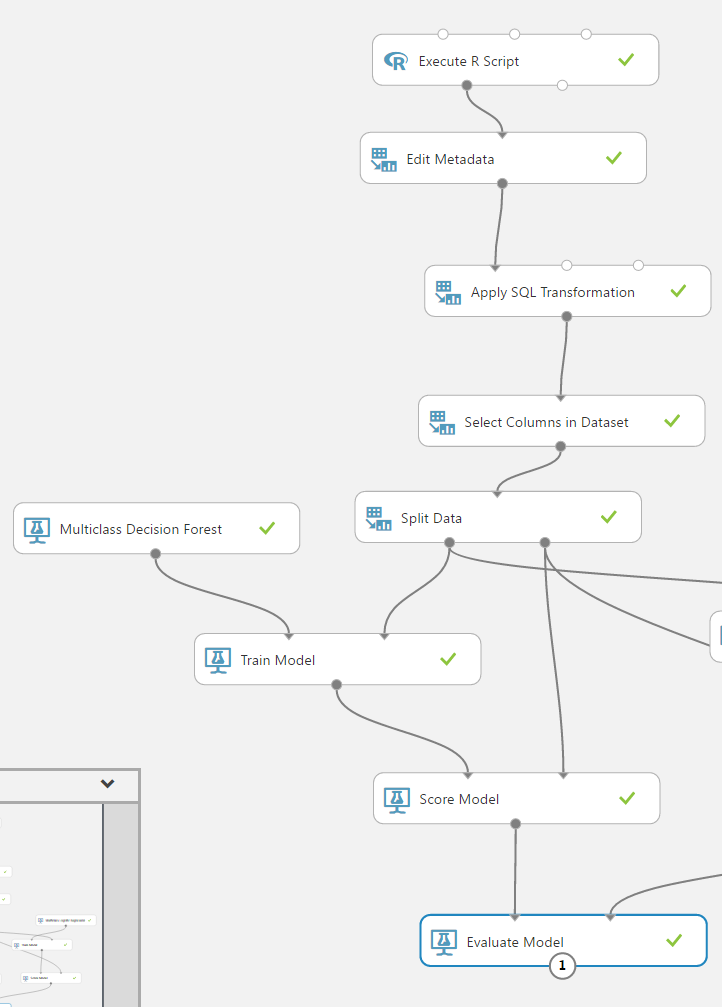
The flow of our operations, should now look similar to this:
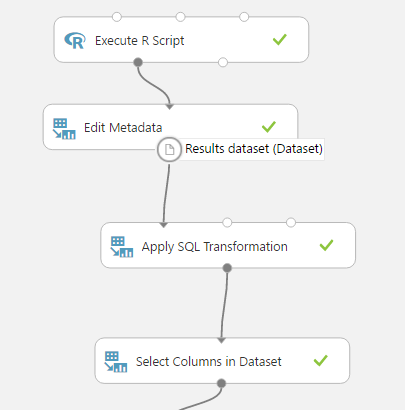
Training a classification model
We are going to try a multi-class classification model, to see where we get. Classification is supervised learning, so we first need to split our data in a training and test set.
Splitting the data in training and test
Using the Split Data block, I’m going to divide the data in two parts 60% as training, and 40% as test set.
Add the model and test it
I first tried with a Multiclass Decision Forest, and I’ve left all the options to the defaults. Next step I added Train Model, as input I use the training set and the model, I also selected the label column as the label. We can visualize the trees that are constructed, by selecting Visualize.
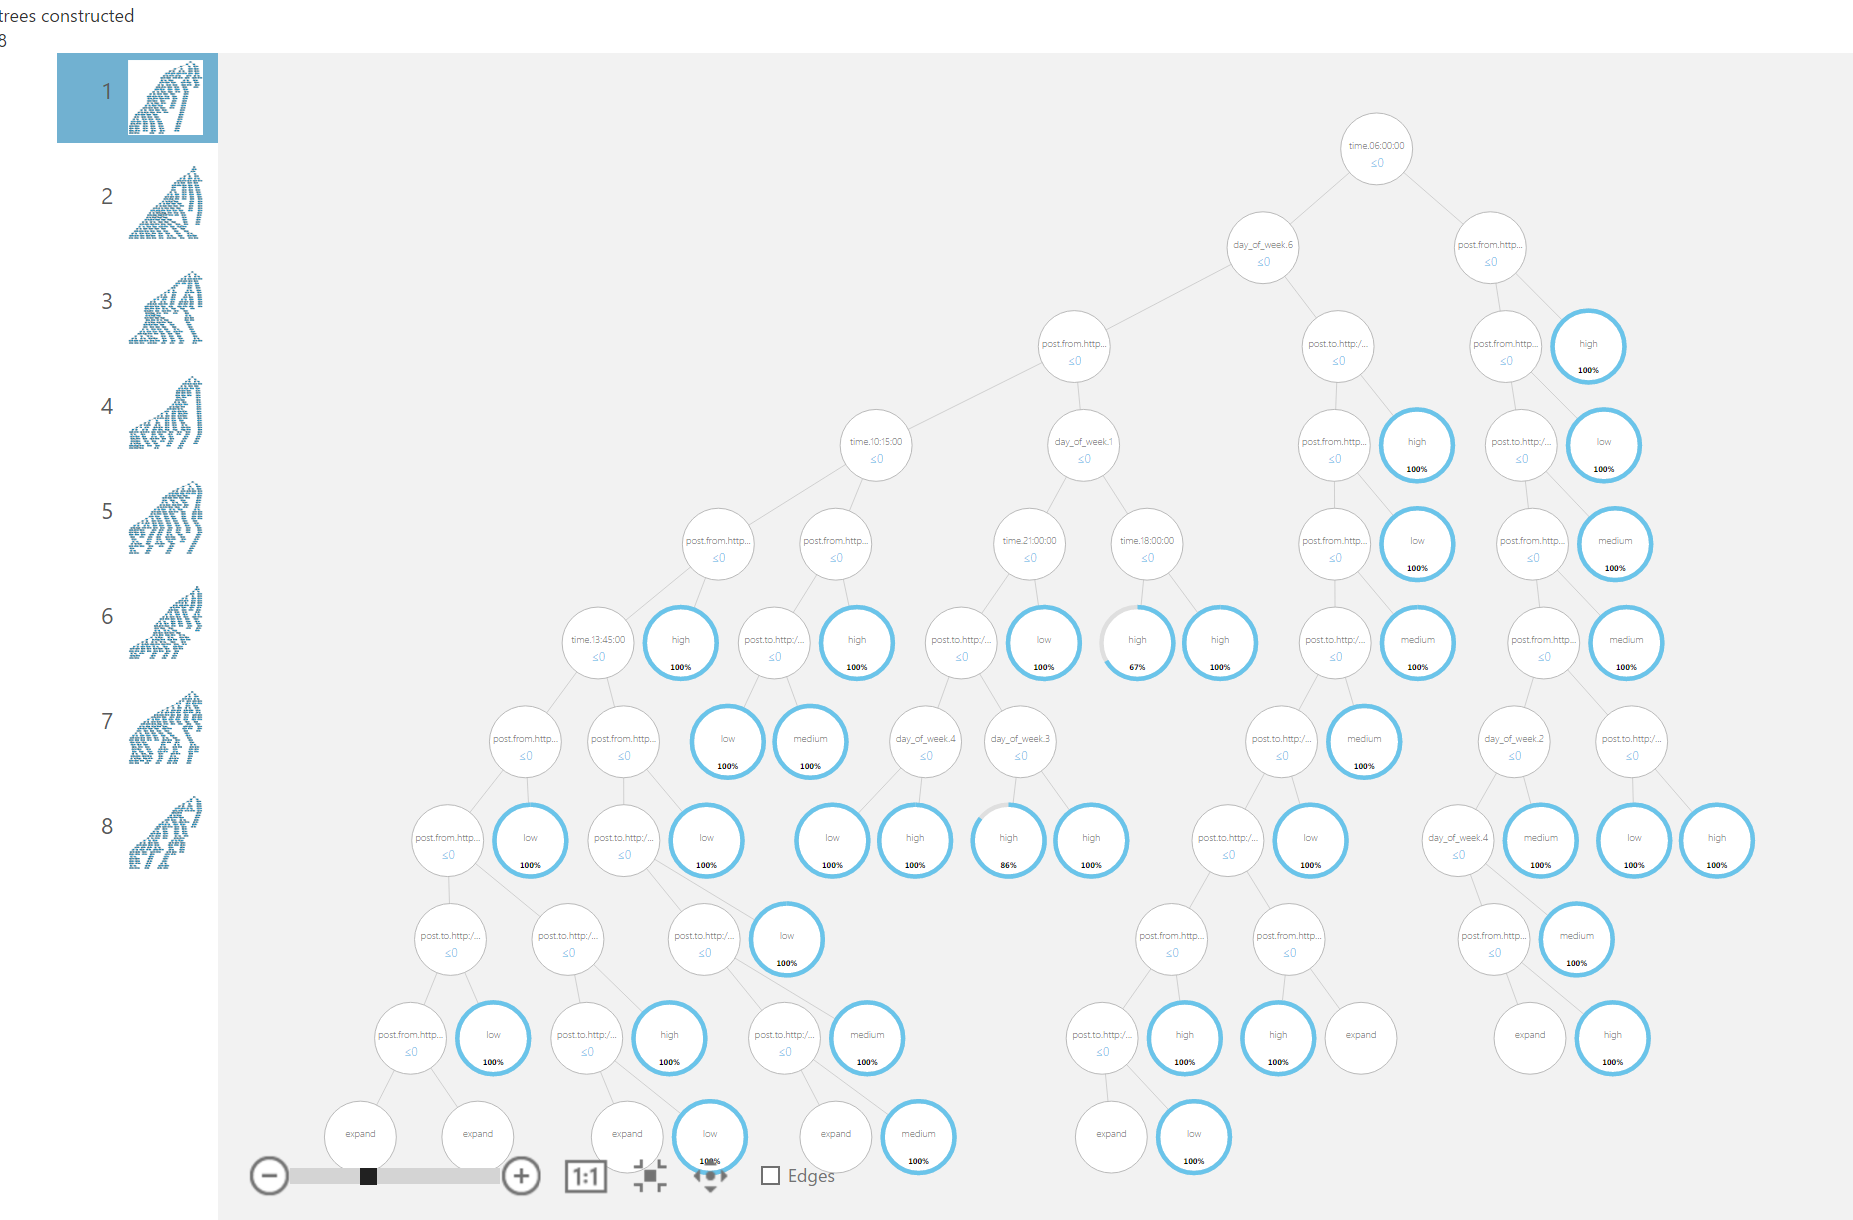
Score the model
Now we are going to apply our model, using Score Model. Here we combine the Trained Model, with the test dataset. We can now see what’s Azure ML classifying:
As final step we are going to measure the performance of the model
Using Evaluate Model we can quickly measure the performance of our models, and even compare multiple algorithms.
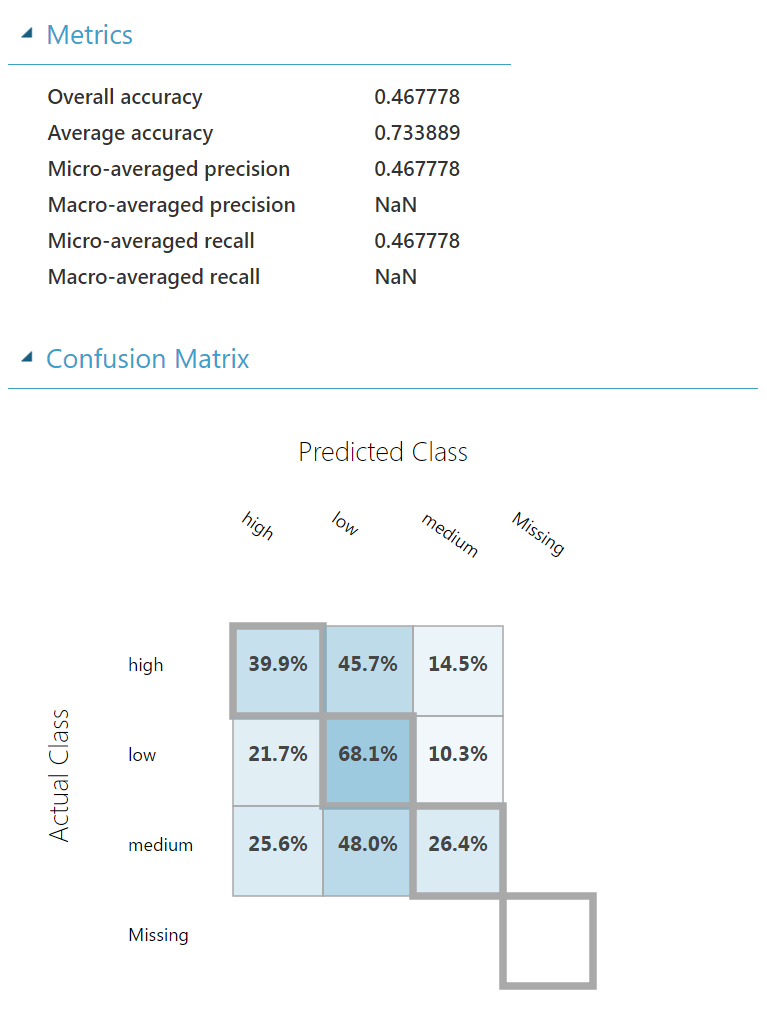
It doesn’t look like we are able to accurately predict occupancy yet. Let’s see if we use a different algorithm we get better results.
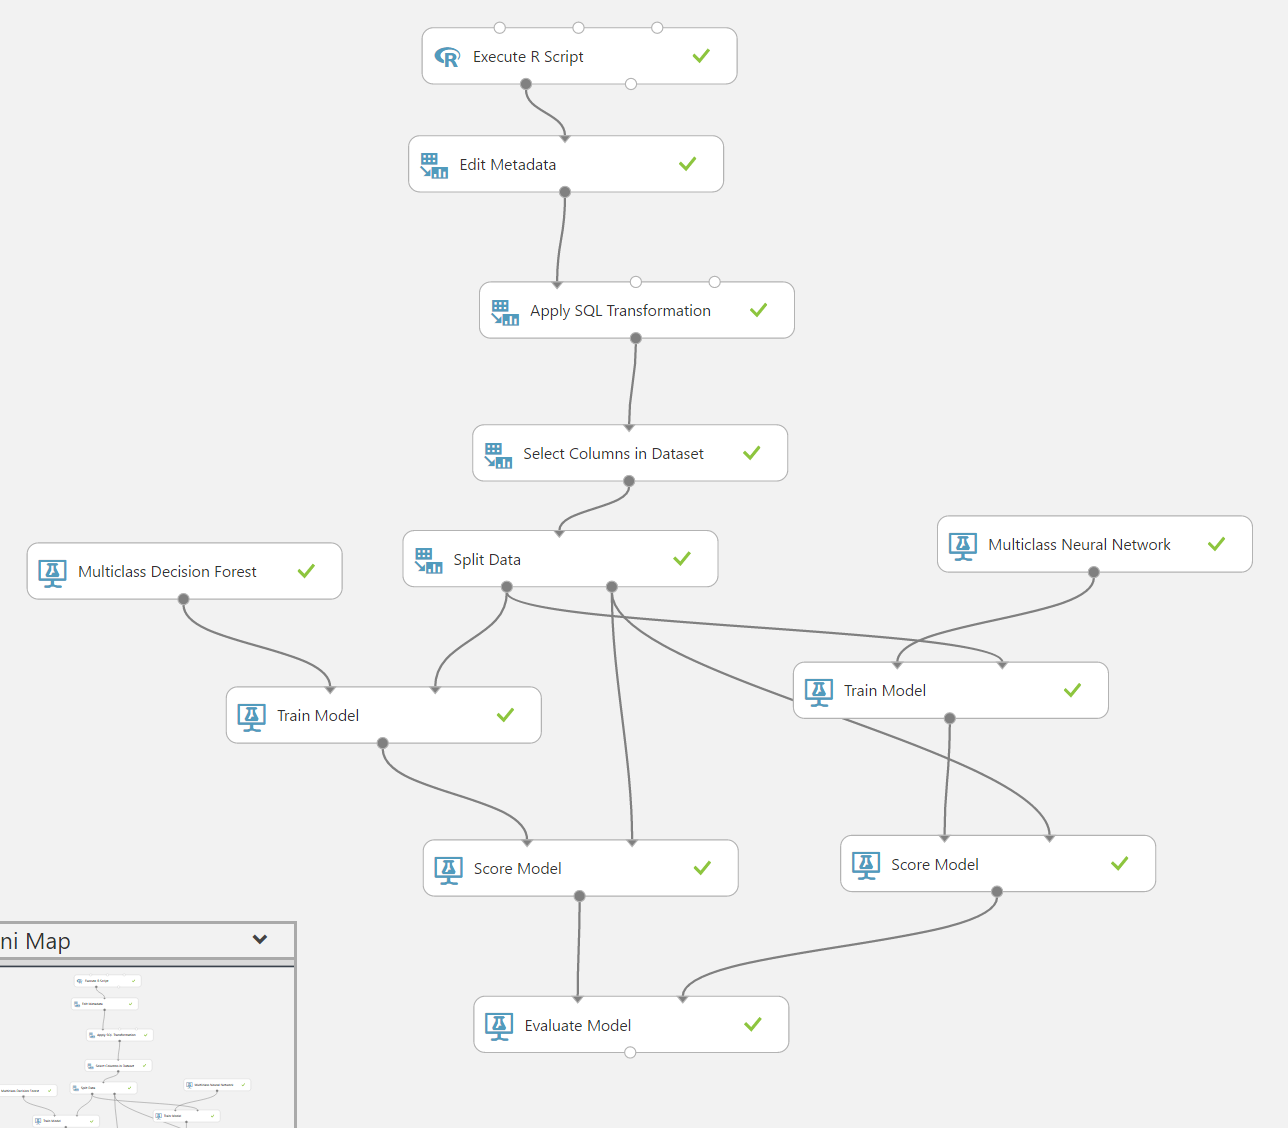
Our flow looks now like this
Comparing Models and Algorithms
Let’s try using a second algorithm and see if we can get better results.
Copy the Train Model and Score Model steps.
Add a Multi-class Neural Network (or another one)
Connect the algorithm to the second Train Model block, that’s it.
Connect the second Score Model to Evaluate Model.
We can now quickly compare the accuracies of both models.
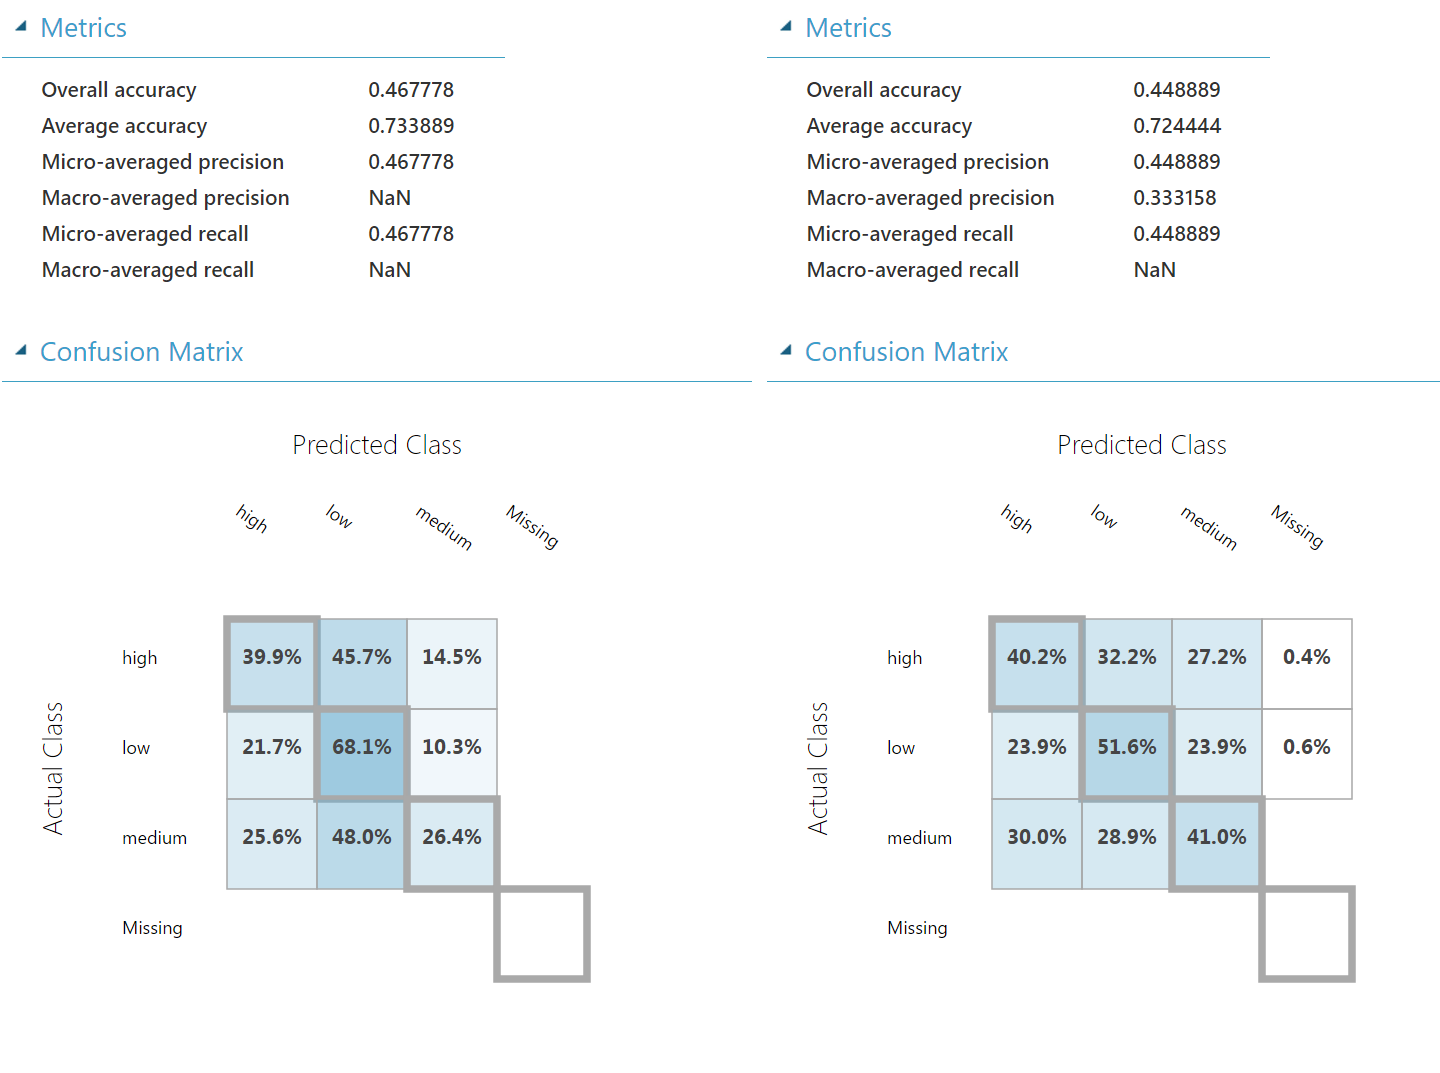
Our pipeline now looks as follows
Bonus: a REST api
Create a Prediction Web Service, to quickly create a REST interface that takes in a single record and outputs the classified value.
Select the Train Model model, you want to use
Select the Train Model block you want to use, and click on SET UP WEB SERVICE.
A second tab is created, called Predictive Experiment
Add a Web service input, and connect it to the first Edit Metadata block. Add a Web service output to the Score Model block.
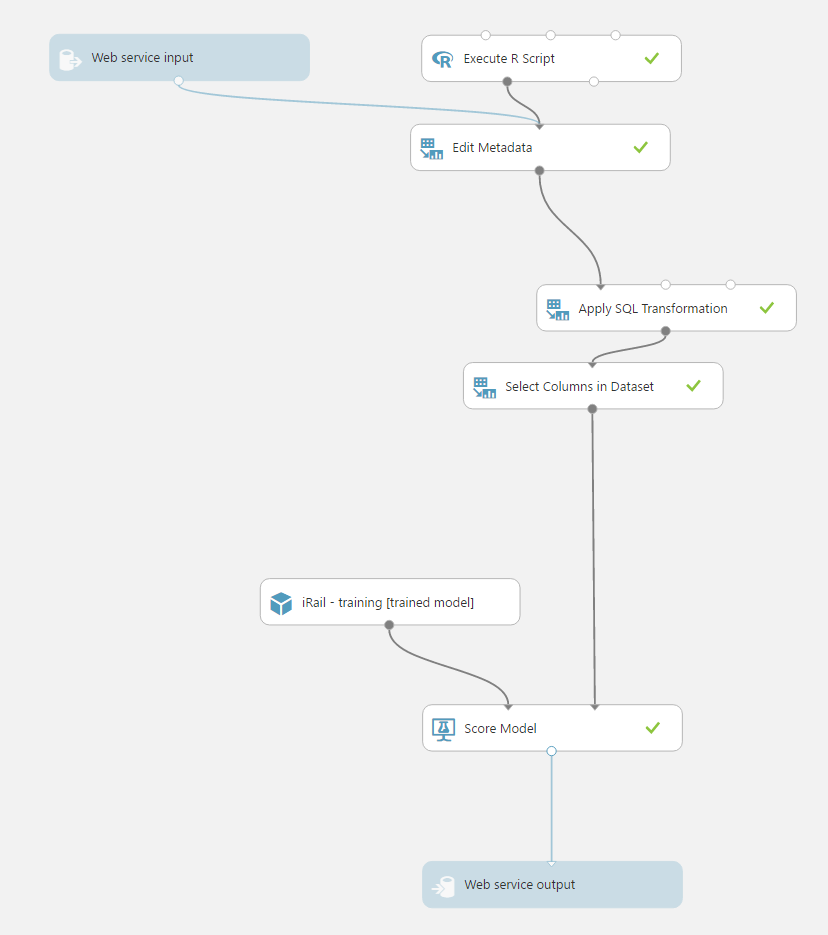
You now have a web service.
Conclusion
Although the model performance is quite low, I hope I have showed you how easy it is to get started with Azure ML. We can improve this model in a few ways:
- By Increasing the amount of data
- As well as the variety of the data
Do let me know if you improve the performance, and how. I might do a follow up myself.
Update
- I just saw that @Gillesvdwiele blogged on it as well. He added weather and vehicle type and reached better results.
- @peeterskris from dataminded.be also created a blog post.
- Apperantly even a kaggle competition exists.